Most voters – 68% – say they are not satisfied with the presidential candidates this year, but Joe Biden’s supporters are more likely than Donald Trump’s to hold this view.
Wide majorities also view the campaign as too negative (68%) and not policy-focused (76%) and say it does not make them feel proud of the country (87%).
Against this backdrop, more than half of voters (53%) would like to see both Biden and Trump replaced as candidates, a share that’s ticked up since April. But Biden supporters are considerably more likely than Trump supporters to say this.
Visit Chapter 2 for more evaluations of Biden and Trump, and Chapter 1 for voters’ 2024 preferences.
Satisfaction with the candidates
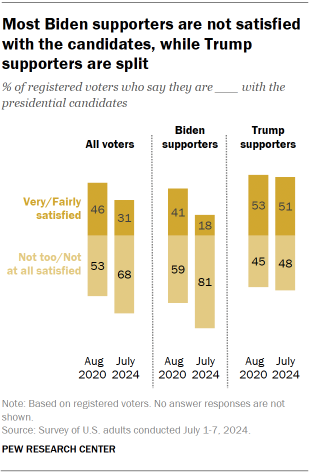
Satisfaction with the presidential candidates is considerably lower than it was at a similar point in the 2020 campaign. This is largely because Biden supporters’ satisfaction today is far lower than in 2020.
- 31% of voters are currently satisfied with the presidential candidates. This is 15 percentage points lower than voters’ satisfaction in the summer of 2020.
- Just 18% of Biden backers are now very or fairly satisfied. In 2020, 41% were satisfied.
- In contrast, roughly half of Trump supporters (51%) are satisfied with this year’s candidates. This is nearly identical to the 53% of Trump supporters who said this four years ago.
There are notable demographic differences in satisfaction with the presidential candidates:
Age
Voters ages 50 and older are 16 points more likely than those under 50 to say they are very or fairly satisfied with the candidates (38% vs. 22%).
Among both Biden and Trump supporters, older voters express more satisfaction with the candidates than younger voters.
Race and ethnicity
Though about a third of Black Biden supporters (36%) say they are satisfied with the candidates, Black Biden supporters are roughly twice as likely as Hispanic (17%) or White (14%) Biden supporters to say this.
Similar shares of White (51%) and Hispanic (50%) Trump backers are satisfied with the candidates.
Many voters would swap out the candidates if they could
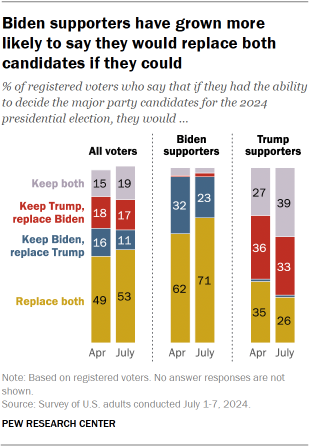
A narrow majority of voters (53%) say they would replace both Biden and Trump with different candidates if they had the ability to decide the major party candidates for the 2024 presidential election. The share saying this is up slightly from the 49% of voters who said this in April.
That shift is largely due to Biden supporters becoming more likely to say both candidates should be replaced:
- 71% of Biden backers now say they would replace both candidates, up from 62% in April.
- The share of Biden supporters who would keep Biden but replace Trump is down to 23%, from 32% in April.
In contrast, Trump supporters have become more likely to say they would keep both candidates over this period.
- Nearly four-in-ten Trump supporters (39%) now say this, up from 27% a few months ago.
- About a quarter (26%) would replace both candidates – down from the 35% who said this in April.
- A third of Trump supporters would keep Trump on the ballot but replace Biden.
Despite changes in Biden and Trump supporters’ views of whether they would replace the major party candidates for president, demographic differences among each candidate’s supporters follow similar patterns to the last time we asked this question in April.
- Within each coalition, younger voters are more likely than older voters to say they would replace both candidates. But majorities of Biden supporters in all age groups say this, while no more than about a third of Trump supporters in any age group do.
- College graduates within each coalition are 15 points more likely than those without a four-year degree to say they would replace both candidates.
- Black voters who support Biden are less likely than other Biden backers to favor replacing both candidates: 58% of Black Biden supporters favor replacing both candidates, compared with 67% of Hispanic, 74% of White and 84% of Asian Biden supporters.
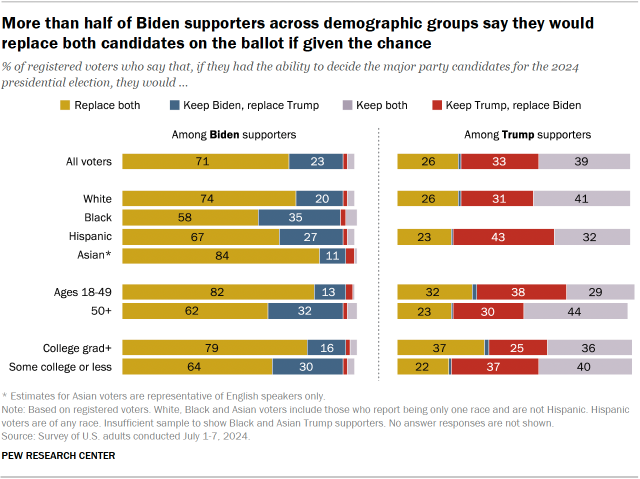
- 43% of Hispanic Trump supporters say that they would keep Trump on the ballot but replace Biden, compared with 31% of White Trump supporters. Similar shares of White Trump supporters (26%) and Hispanic Trump supporters (23%) say they would replace both.
Voters’ views of the campaign so far
Voters characterize the presidential campaign so far in largely negative terms:
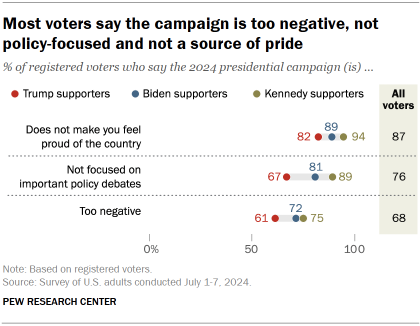
- Only 12% say that the campaign makes them feel proud of the country, while 87% say it does not make them feel proud.
- 76% say the campaign is not focused on important policy debates, while just 23% say it is.
- And 68% say that the campaign is too negative. Just 30% say it is not too negative.
Majorities within both candidates’ coalitions describe the campaign as not making them feel proud of the country, not focused on important policy debates, and too negative.
Yet Biden supporters are more negative than Trump supporters in each case – and supporters of third-party candidate Robert F. Kennedy Jr. hold particularly negative views of the campaign so far.
- Kennedy supporters are nearly unanimous in saying that the campaign does not make them proud of the country (94% say this). Slightly smaller shares of Biden (89%) and Trump (82%) supporters feel this way.
- Kennedy supporters (89%) are also more likely than Biden (81%) or Trump (67%) supporters to say the campaign is not focused on important policy debates.
- And while similar shares of Kennedy (75%) and Biden (72%) supporters say the campaign is too negative, a narrower majority of Trump supporters (61%) say this.
Views of the 2024 campaign are somewhat more negative than views of the 2020 presidential campaign were at about this time four years ago.
- In August of 2020, 73% of voters said that year’s campaign was not focused on important policy debates (76% say this about the current campaign). About six-in-ten (61%) said the 2020 campaign was too negative (68% say this today).
- Biden supporters are 13 points more likely to describe the current campaign as too negative than 2020 Biden backers were to describe that campaign (59% then vs. 72% now). Trump supporters’ views are nearly identical to those of Trump supporters four years ago.
- And while Biden supporters are also more likely to describe the 2024 campaign as not focused on important issues than his supporters were in 2020 (81% say this in 2024 vs. 73% in 2020), Trump supporters are less likely to describe the current campaign this way (67% in 2024 vs. 74% in 2020).
Voters’ emotions if Biden or Trump won
Voters’ feelings about the possibility of a Biden or Trump win are similar to how voters felt in 2020 about these potential outcomes.
Among Biden supporters
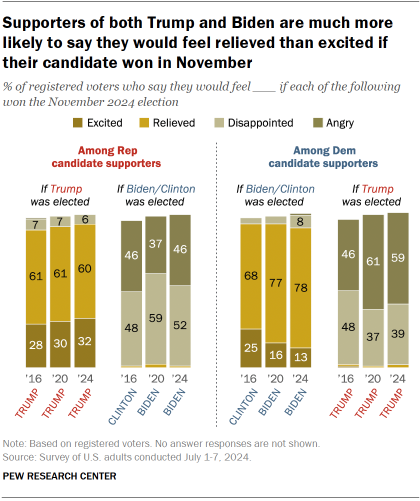
Roughly three-quarters of Biden supporters (78%) say they would feel relieved if Biden won in November, while slightly more than one-in-ten (13%) say they would feel excited if Biden won. These views are nearly identical to how Biden supporters felt about the prospect of a Biden victory four years ago.
About six-in-ten Biden supporters (59%) say they would feel angry if Trump won in November, while 39% say they’d be disappointed. These feelings also are nearly identical to the shares with these views four years ago (61% angry, 37% disappointed).
Among Trump supporters
Among Trump supporters, the shares who would feel relieved (60%) or excited (32%) if their preferred candidate won are similar to the shares who said they would feel relieved (61%) or excited (30%) in 2020.
However, Trump supporters are 9 percentage points more likely to say they would feel angry if Biden was elected this November than they were at this point in 2020 (46% today, 37% in 2020) and 7 points less likely to say they would feel disappointed (52% today, 59% in 2020).


